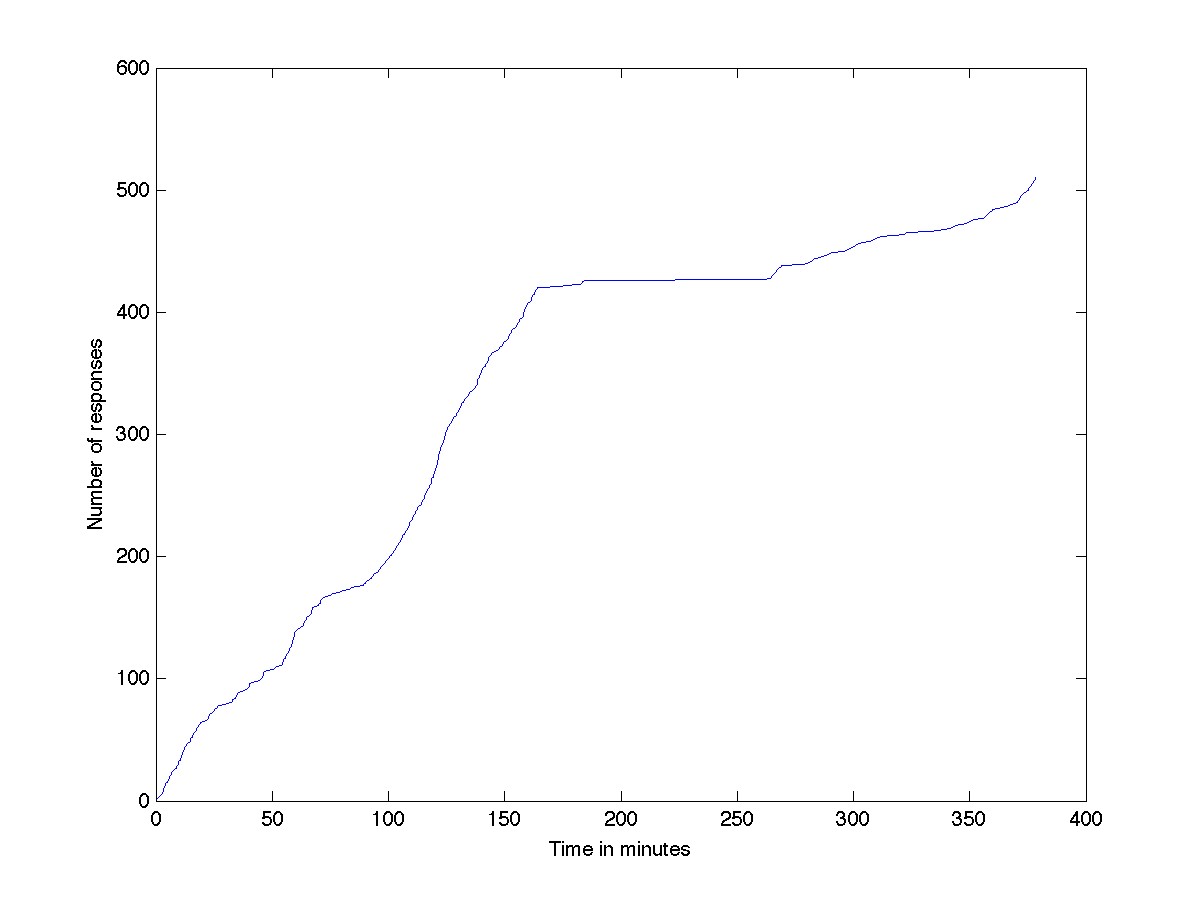
Image labeling progress:
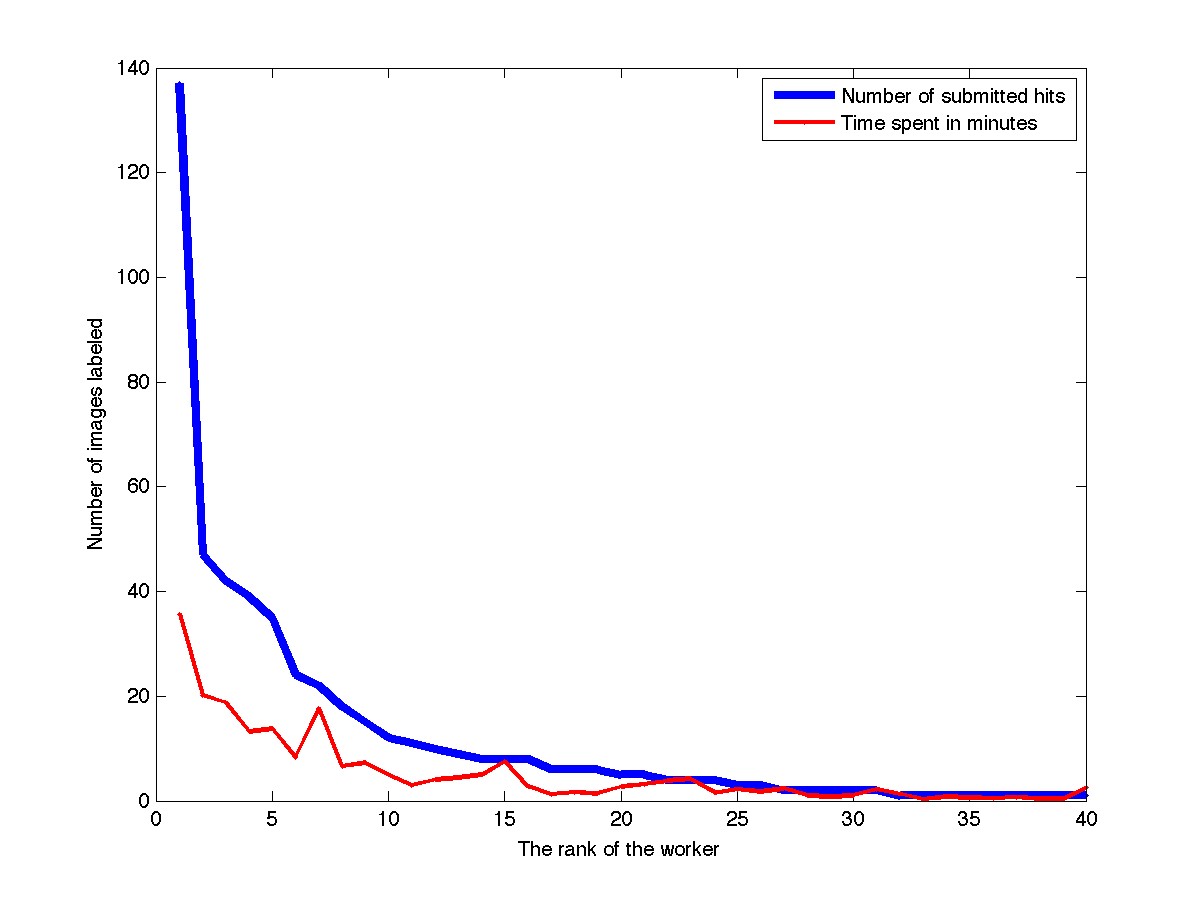
A plot of contributions per worker:
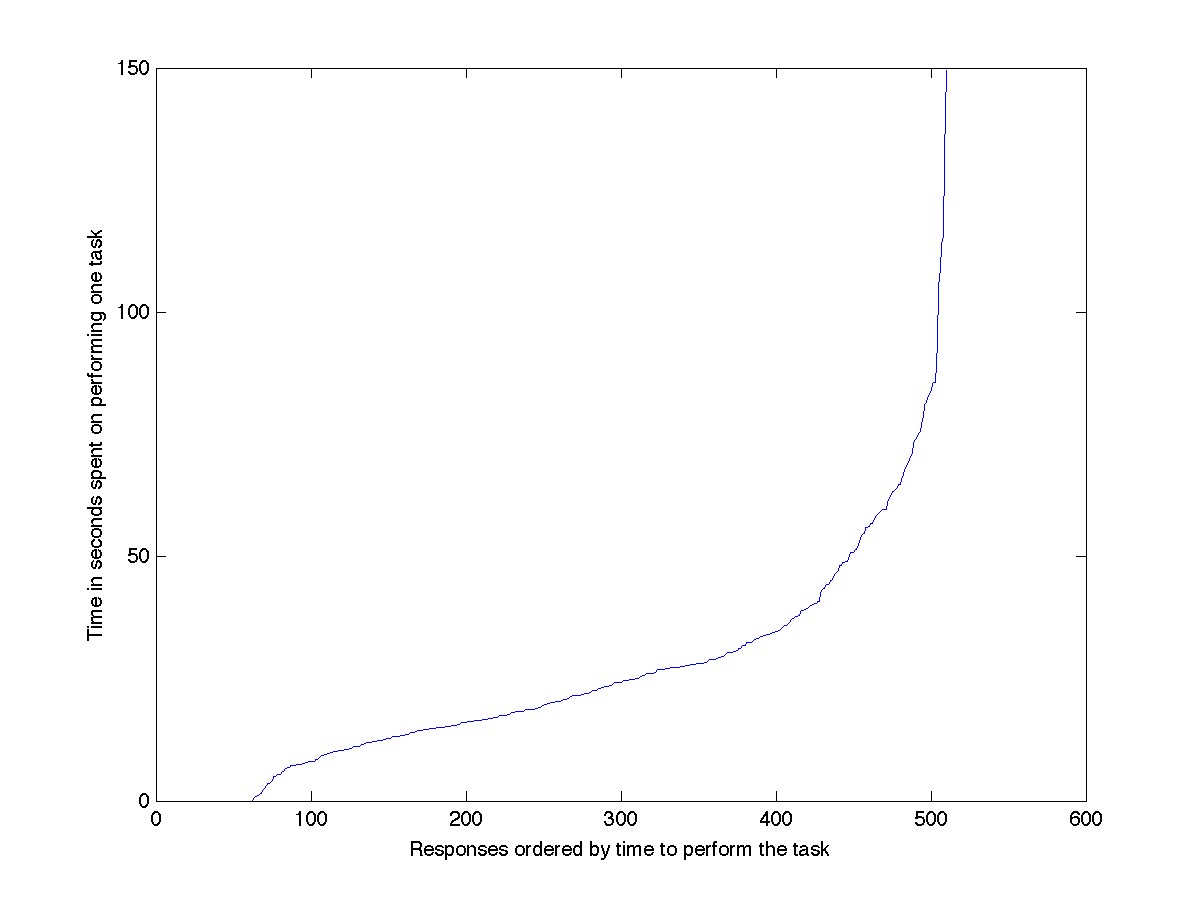
A plot of time spent on single task:
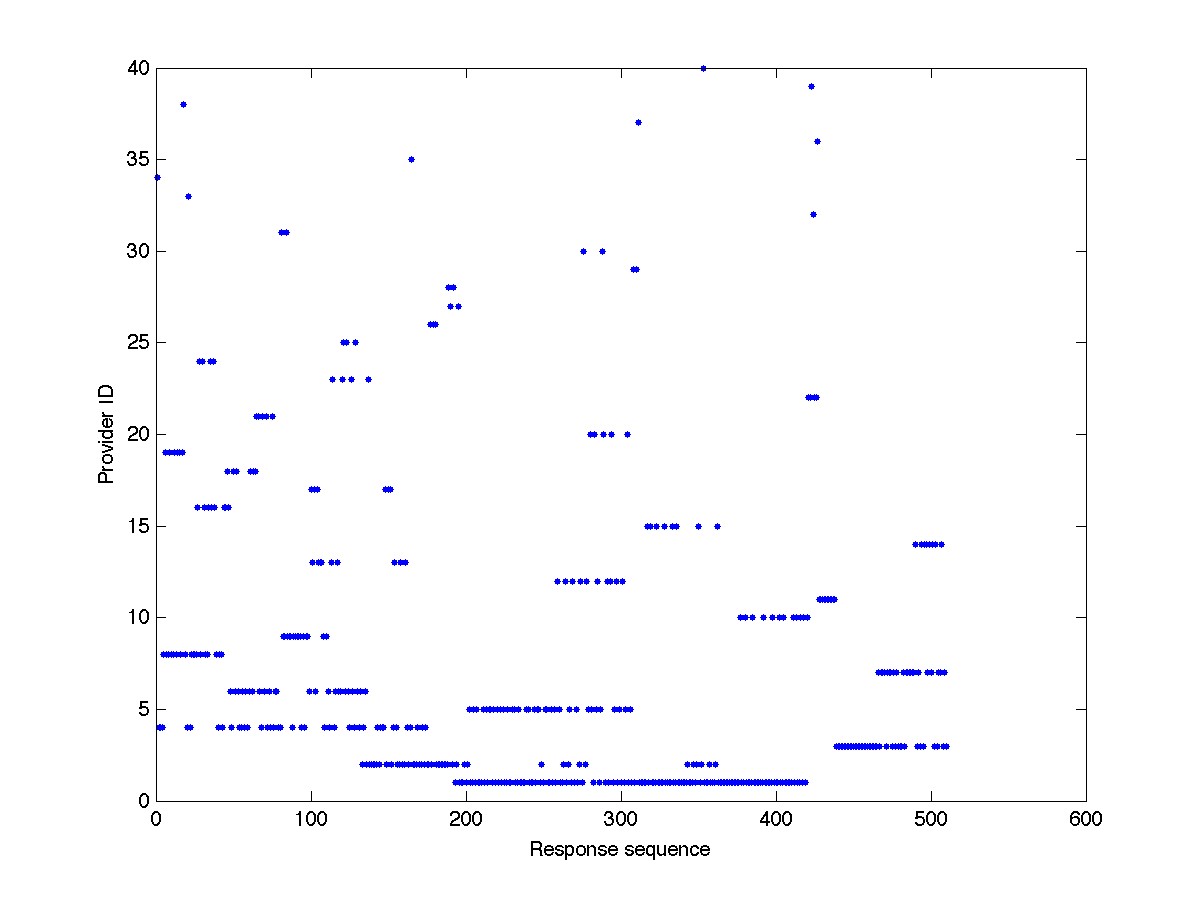
A plot of user activity, submissions scale. Workers are ordered by productivity (most productive at the bottom):
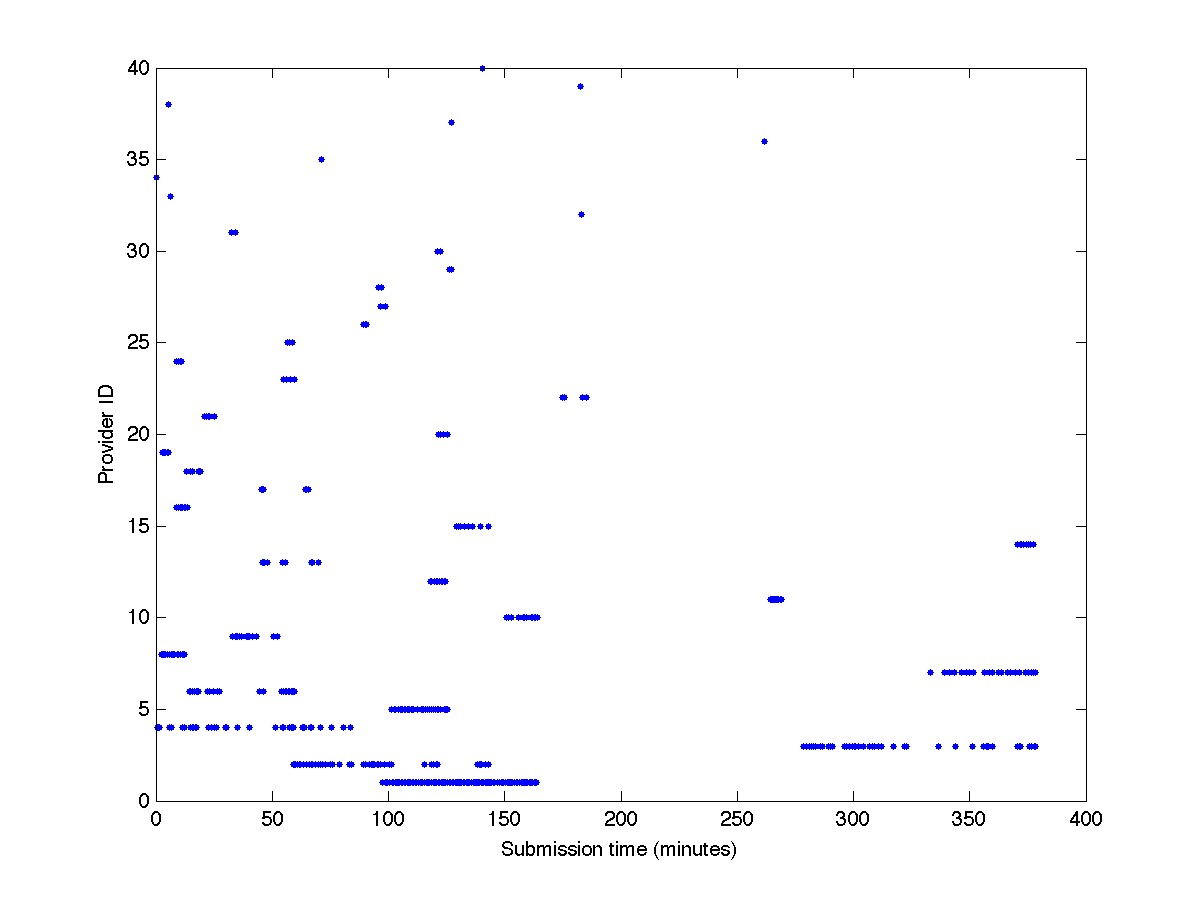
A plot of time user activity, time scale. Workers are ordered by productivity (most productive at the bottom):